Body Mass Index → Graph
Contents:
BMI Graph (Metric units)
↑ Height [meter]
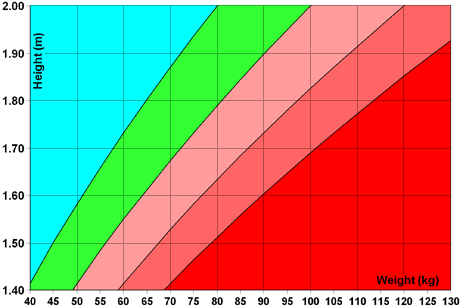
→ Weight [kilogram]

BMI Graph (Imperial units)
↑ Height [feet, inch]
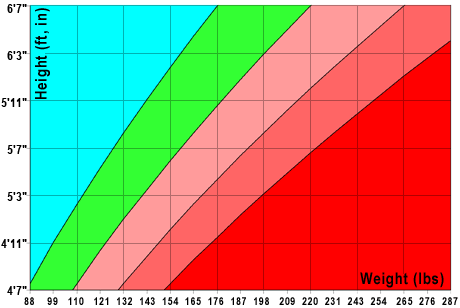
→ Weight [pounds]
Legend:
| Underweight |
Normal |
Overweight |
Obese |
| |
|
|
|
|
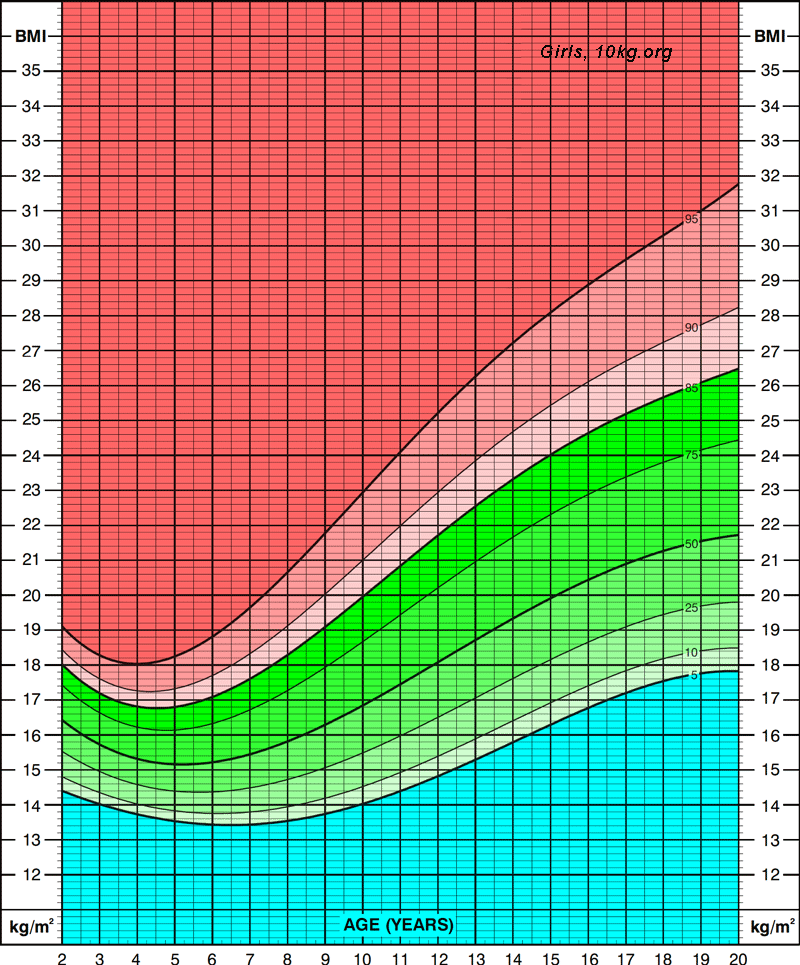
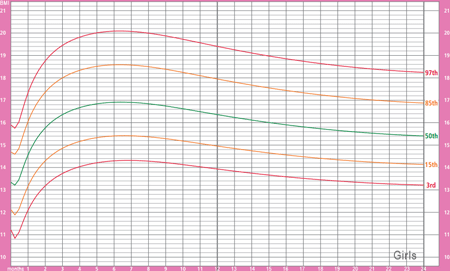
Kids, teens (2-20 years) (female)
↑ Body Mass Index [kg/m²]
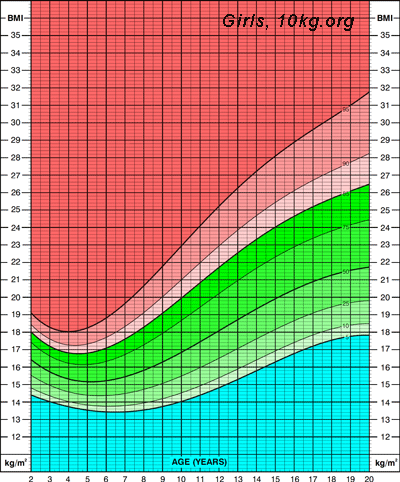
Age [years]→
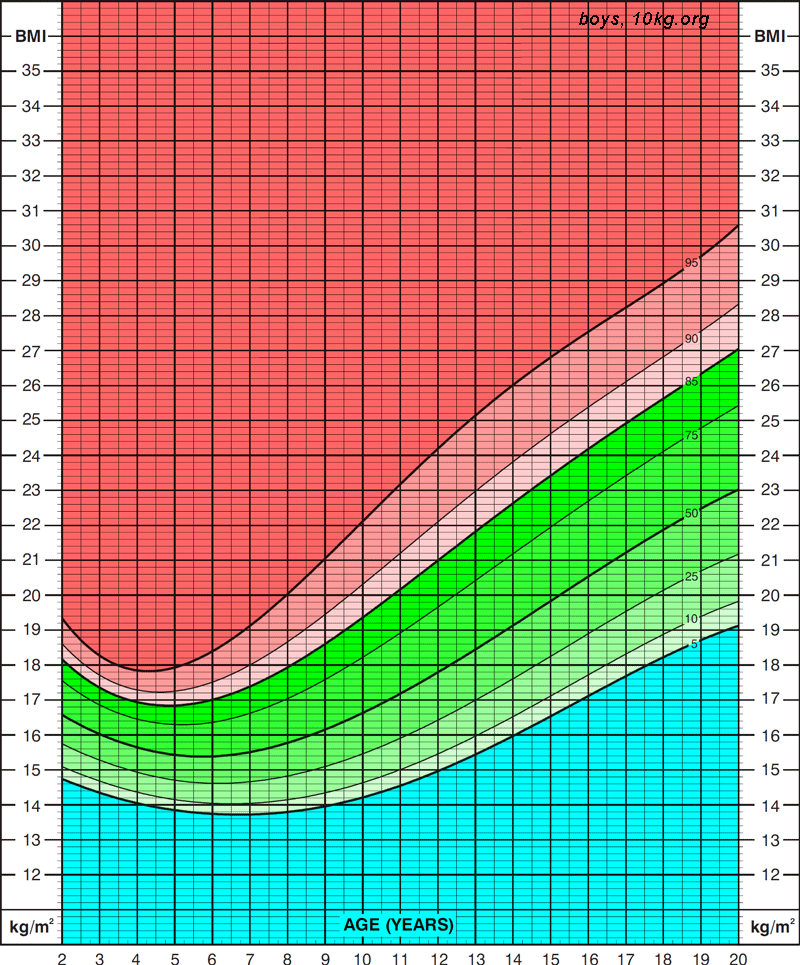
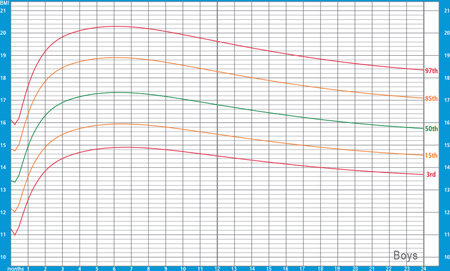
Kids, teens (2-20 years) (male)
↑ Body Mass Index [kg/m²]
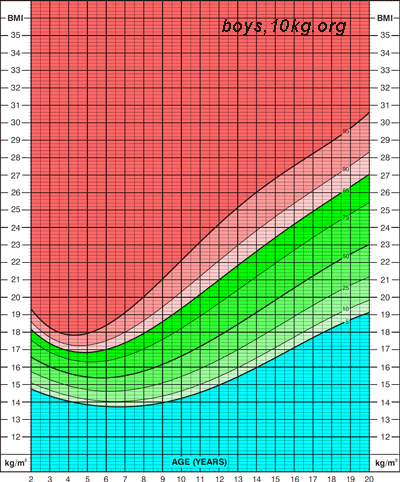
Age [years]→
| Underweight |
Normal |
Overweight |
Obese |
| |
|
|
|
|
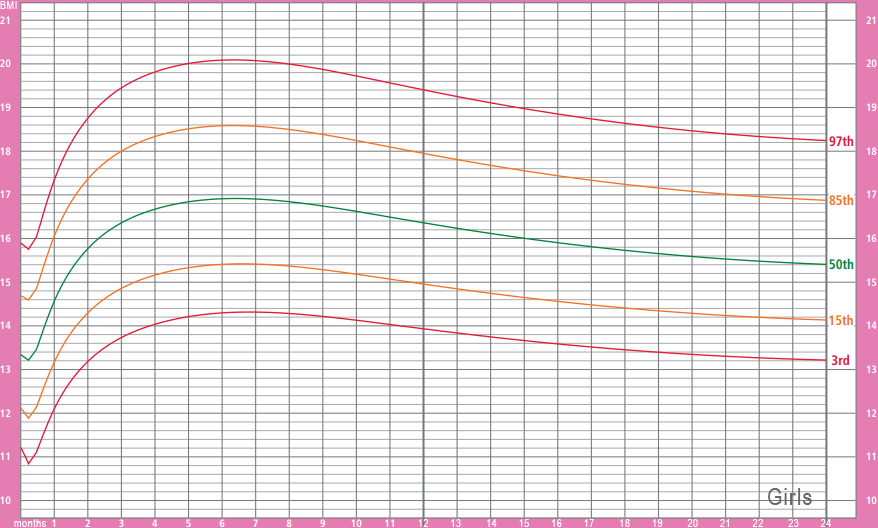
Babies BMI Graph (0-2 years, female)
↑ Body Mass Index [kg/m²] (Results: percentile)
Age [months]→
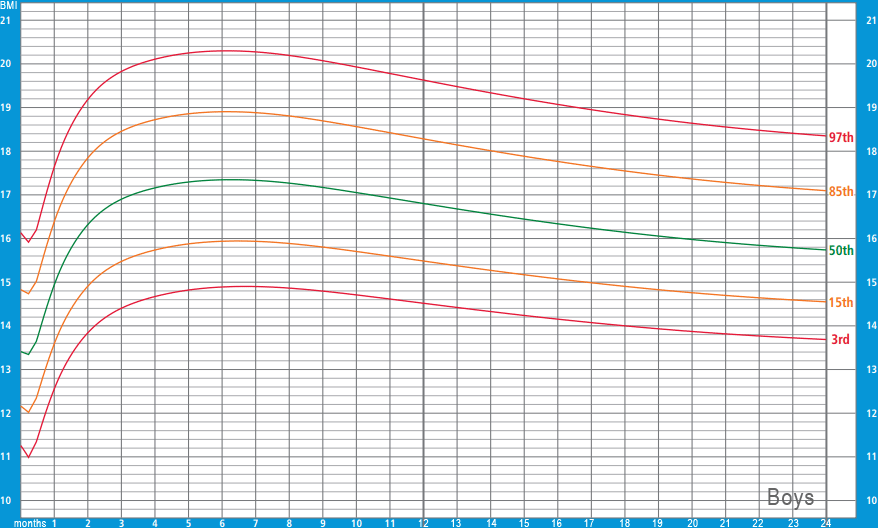
Babies BMI Graph (0-2 years, male)
↑ Body Mass Index [kg/m²] (Results: percentile)
Age [months]→
Source: